Introduction
The evidence below makes the case for the program, and you can borrow any of it for a proposal or for marketing.
More than three-quarters of college students report moderate or high stress (ACHA, 2024), and finals week concentrates it into a few high-stakes days. Elevated stress, anxiety, and depression are linked to weaker cognitive control and lower task accuracy (Walia et al., 2026), the very capacities finals demand.
Many students already study with music in the background. Lo-fi has become a default study soundtrack (Zeng & Sobande, 2026), and a pilot study found it significantly reduced state anxiety in young adults (Dsouza et al., 2024). A randomized study found focus music improved sustained attention and lowered physiological arousal versus silence (Kirk et al., 2022).
The design matters as much as the event. Finals-week wellness programming can backfire when it's loud and performative (Wilson, 2026). A low-sensory model fits the way students already study.
Our Lo-Fi Day
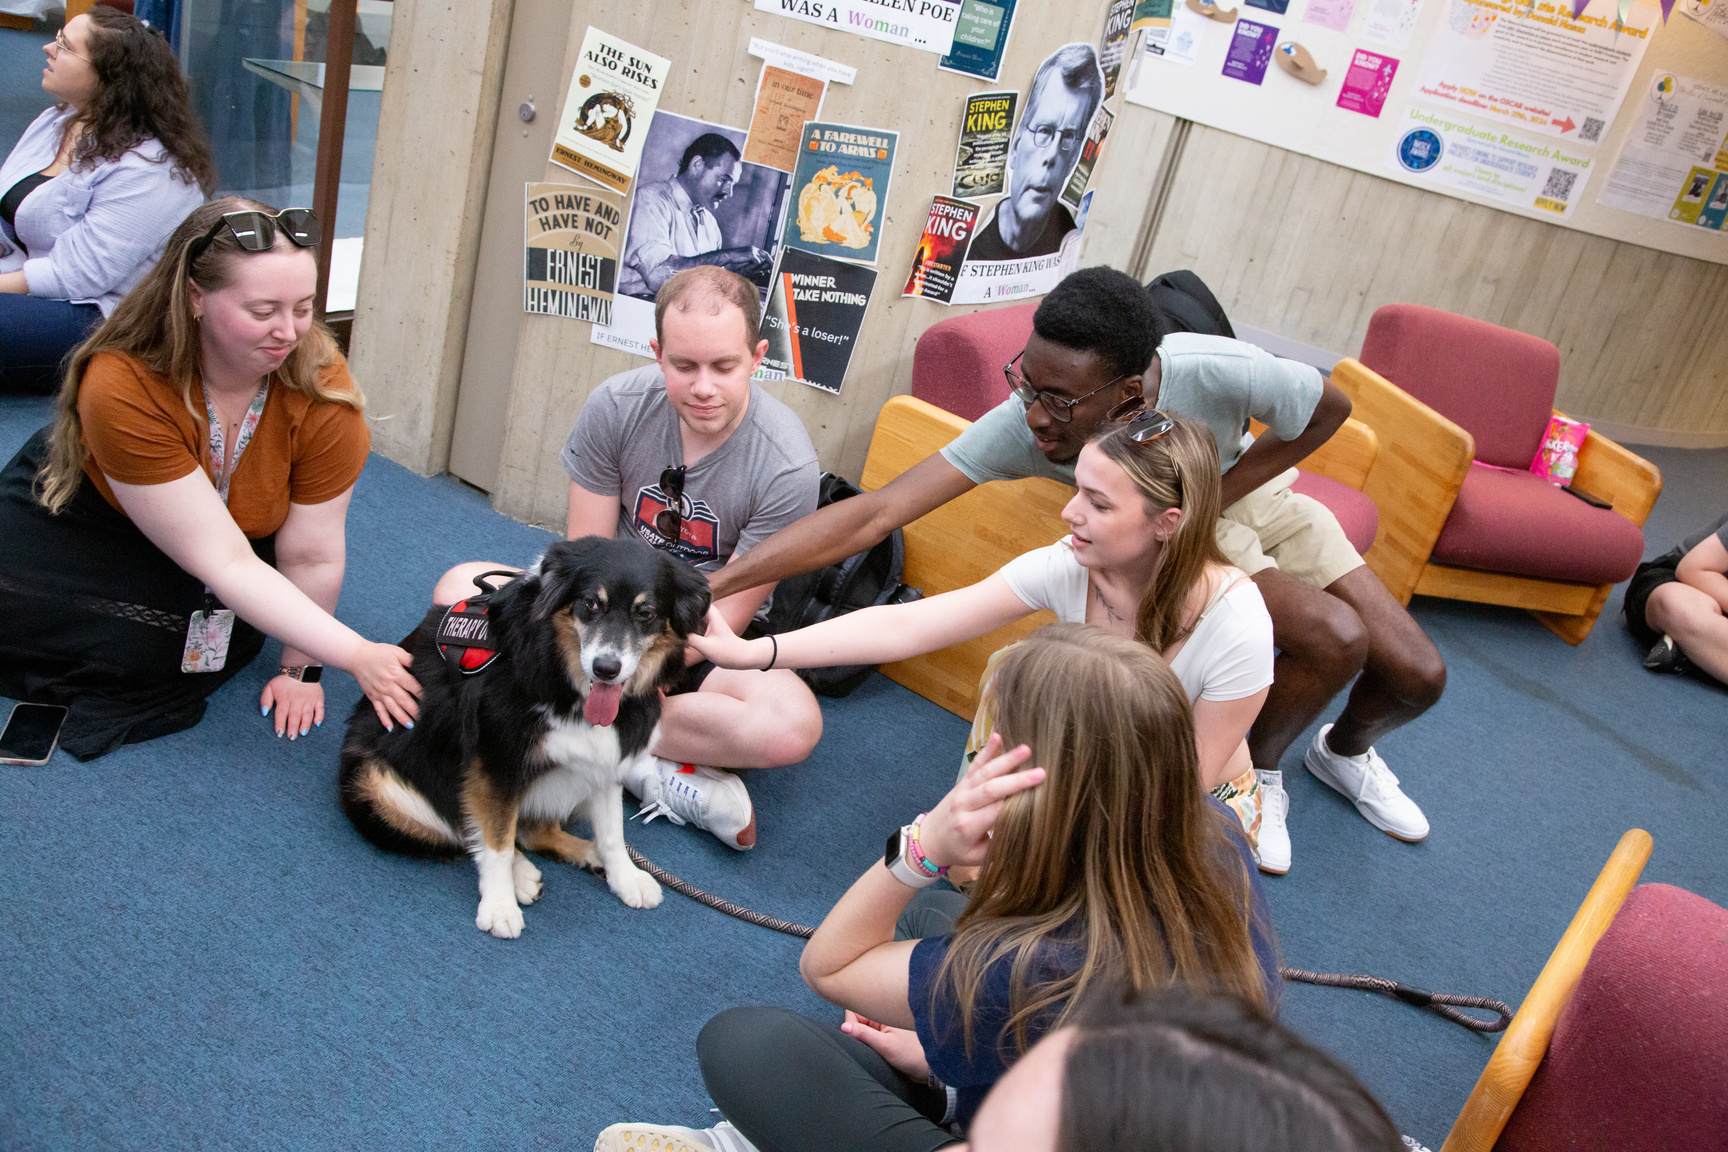
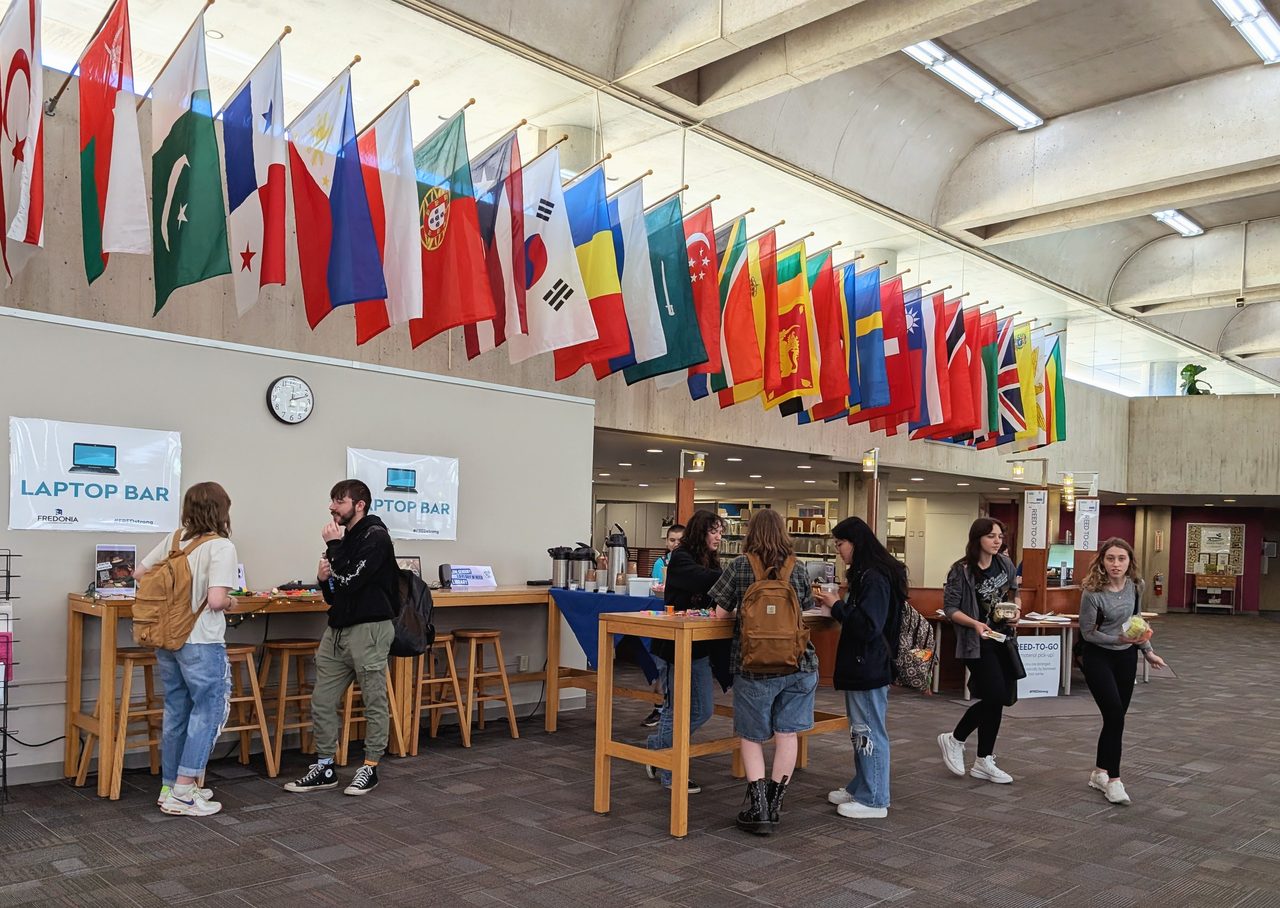
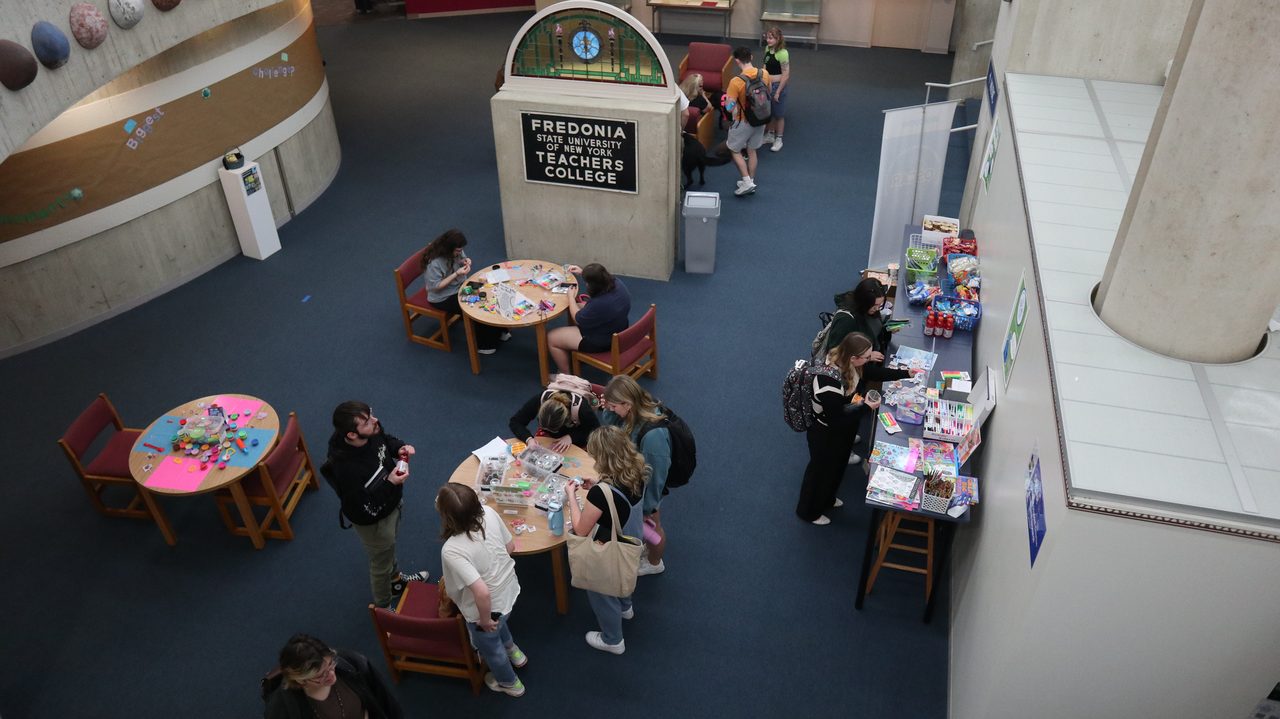
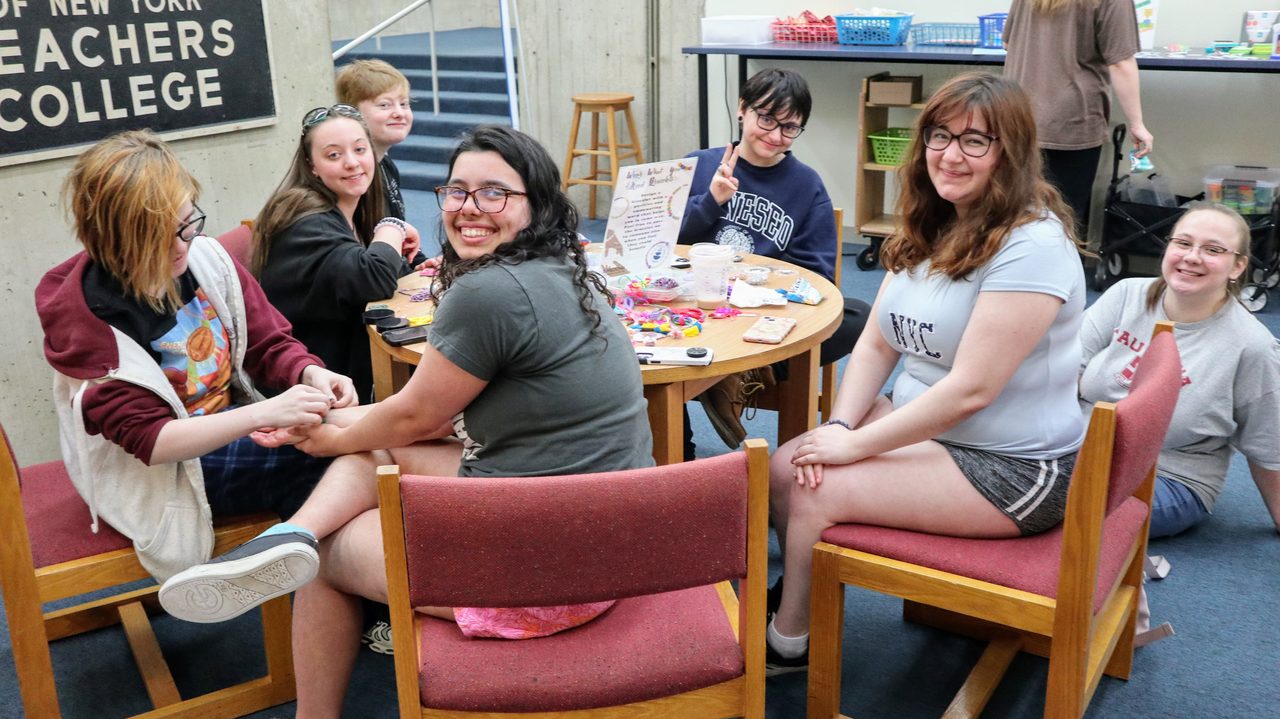
We started Low-Sensory Lo-Fi Day at Daniel A. Reed Library in Fall 2024, and have run it every study week since. It turns the library into a calm retreat in the lead-up to finals, set to the mellow, looping beats of the Lofi Girl stream, with free coffee, therapy dogs and low-key activities. Students pick their comfort level: a calm but communal space or a fully quiet room with no sound at all. Here is what four runs looked like, in photos and in the numbers.
Photo gallery
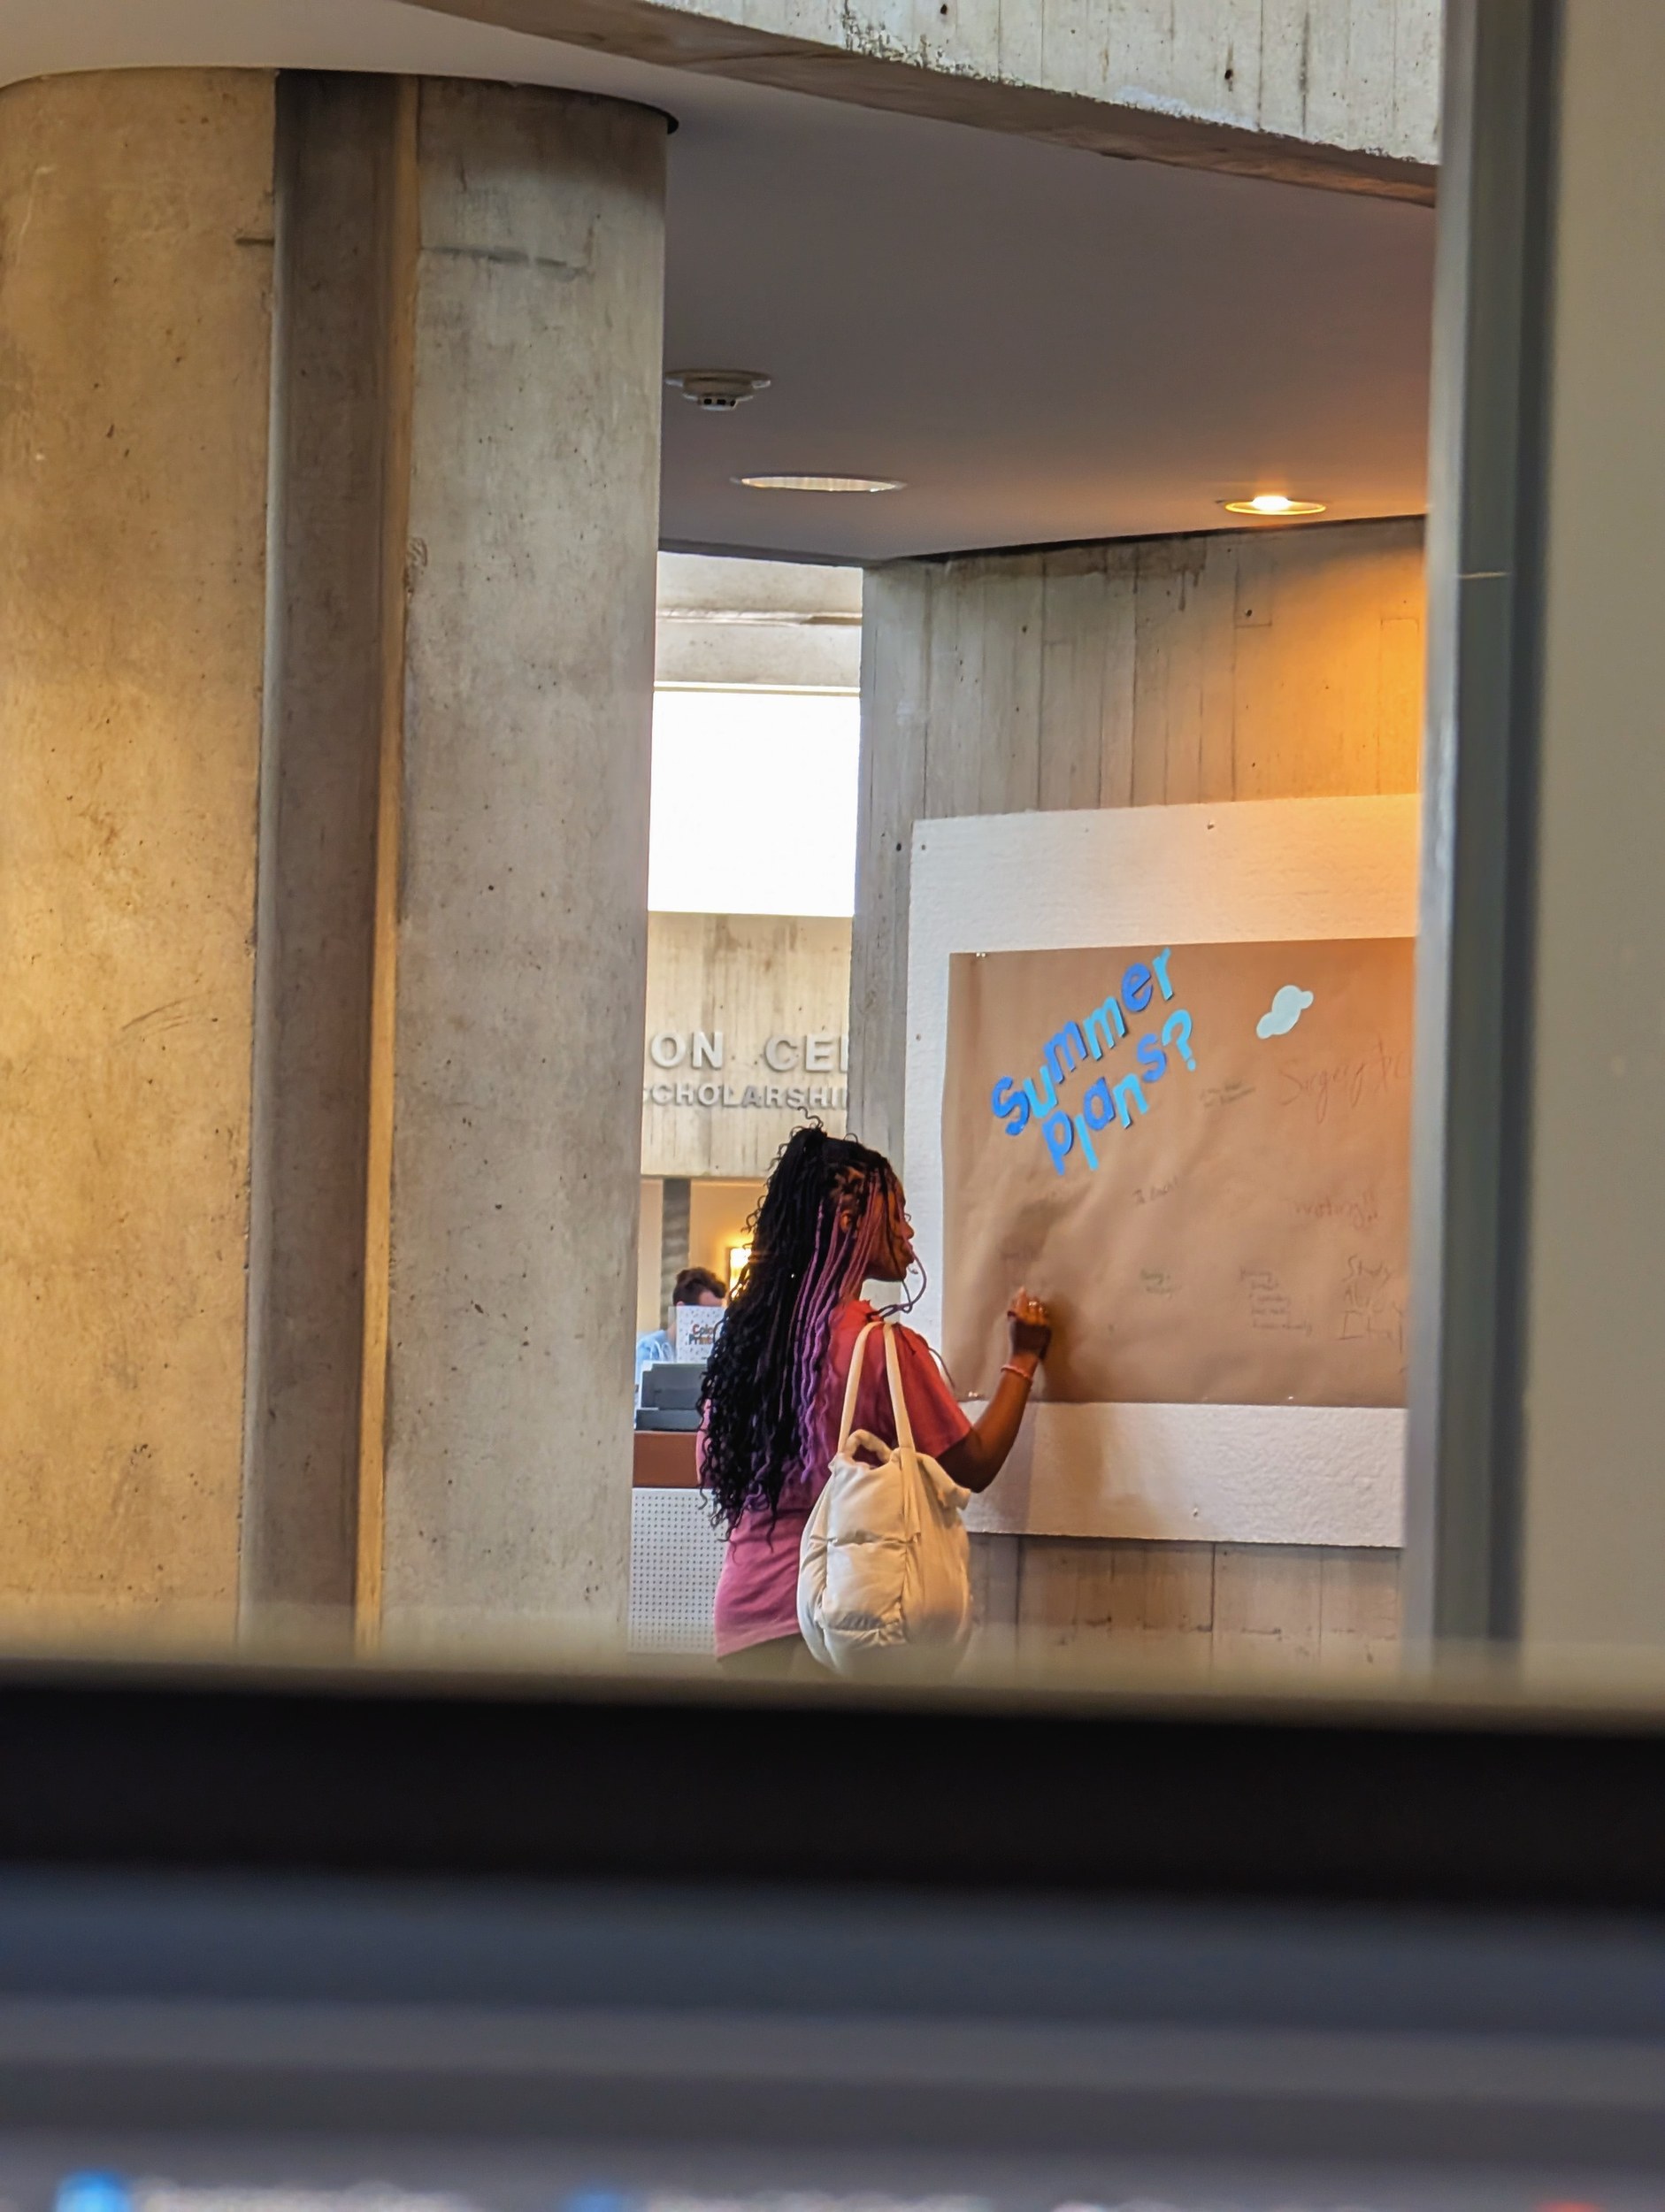
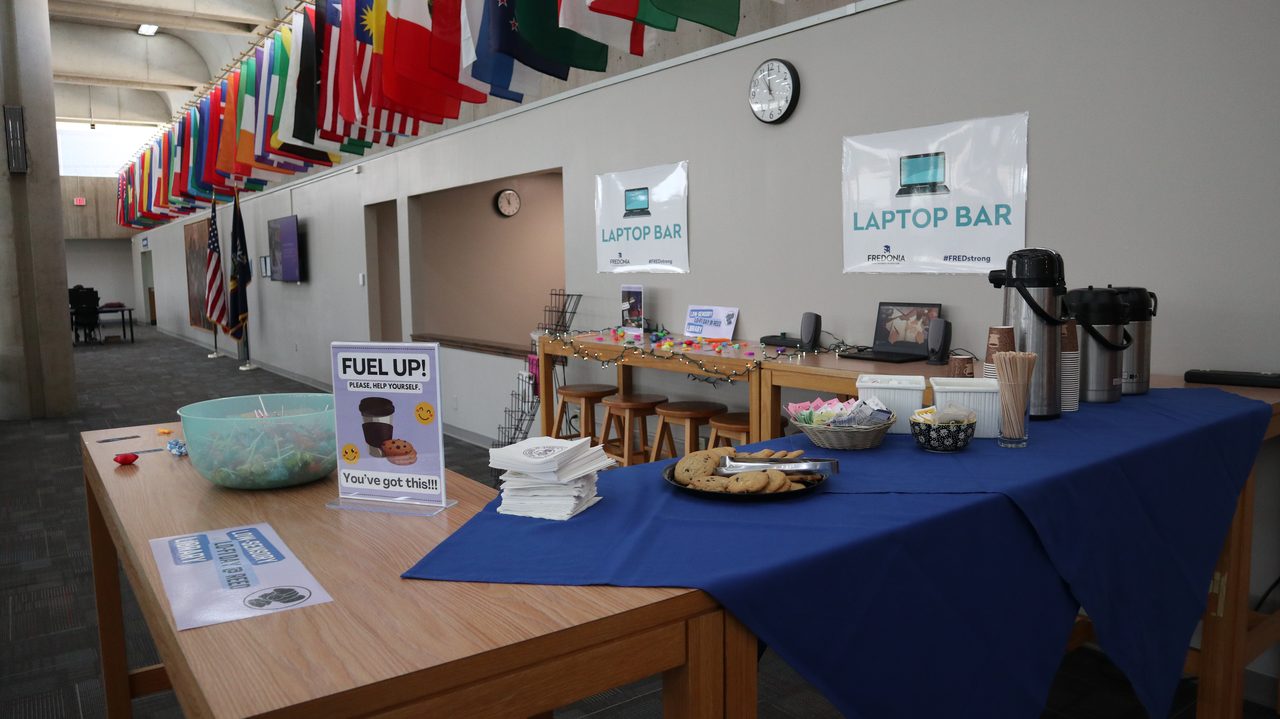
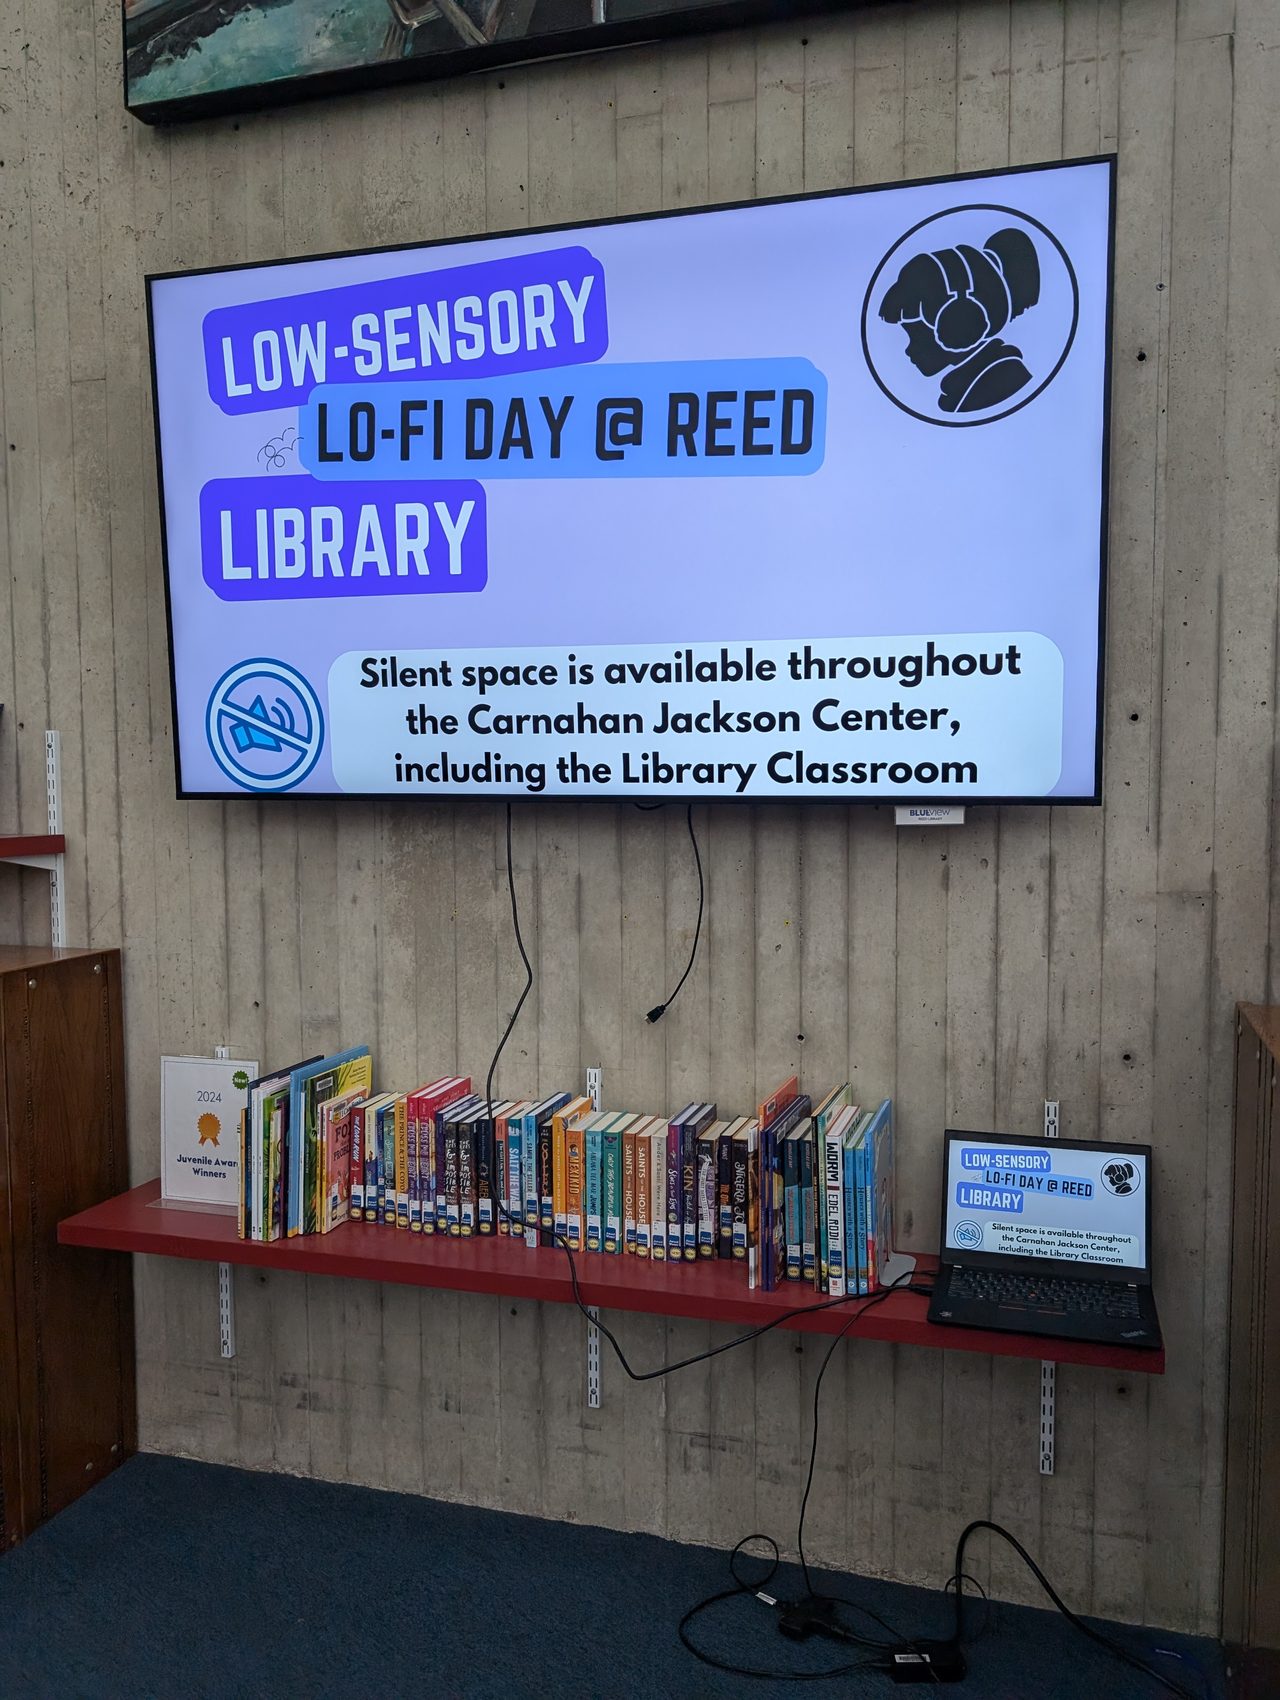
These are scenes from Lo-Fi Day at Reed Library. Use the arrows to flip through them.
The data
Four runs of Lo-Fi Day at SUNY Fredonia's Reed Library, drawn from the library's half-hourly patron count.
Where this was presented
- SUNYLA 2026 (SUNY Brockport). “Low-Sensory Lo-Fi Day: Creating Calm in the Library for Student Success.” Christina Rose Hilburger & Owen Wagner. View the digital poster →
- ALA Annual 2026 (Chicago). “Creating Calm: A Low-Sensory Lo-Fi Model for Academic Libraries.” Poster session, Diversity Fair. Christina Rose Hilburger. View the digital poster →
Plan your own
Everything to pitch it, plan it, run it, and measure it. Jump to what you need.
Pitch it to your supervisor
Fill in your details and download a ready-to-send proposal, in Word or PDF. Edit it however you like before sending.
It all runs in your browser. Nothing you type is sent anywhere or saved, and no AI is involved. It just fills in the template for you.
Live preview
How to host one
These six steps take you from idea to event, and the model is meant to stay low-cost and low-tech.
Pick your space & date
Choose a central, comfortable area students already use, and schedule during the highest-stress window, typically the start of finals or study week. Co-scheduling with an existing wellness week boosts turnout.
Set up the sound
Run a continuous lo-fi stream (we use the Lofi Girl livestream) on the library's screens with audio over the speakers. Because it's a single continuous live broadcast, YouTube doesn't interrupt it with ads, and every screen showing it stays on the same song. No subscription needed, so the sound costs nothing.
Create two zones
A communal zone with music, snacks, and activities (ours is the library's OSCAR Hub, our space for student creativity and research), plus a separate quiet, low-stimulus retreat for students who need calm without sound. See the activity menu below.
Line up partners
Reach out to counseling/wellness services, student government, and clubs for therapy dogs, funding, snacks, and co-promotion. See the collaborators section for who to ask.
Promote it everywhere
Use printed flyers, digital screens, social media, and word of mouth. Grab the ready-to-edit templates below.
Count & capture
Track headcounts at intervals and snap photos (with consent). The numbers and quotes make next year's pitch easy.
Set the mood
Here's a sample of the sound. On the day, we run the Lofi Girl live stream on every screen and over the speakers.
Our favorite study mix
A go-to archived Lofi Girl session, calm, looping, and instrumental. Ambient sound for a low-sensory study space.
More on the Lofi Girl channel →Activity menu
Mix and match to fit your space and budget. Two zones let students choose their comfort level. Hover or tap any tag for a tip on what to look for.
Lo-Fi, Library Proper
Quiet Retreat
Supplies & rough budget
This is a starting checklist with example costs, so swap in your own numbers and quantities.
| Item | Notes | Est. cost |
|---|---|---|
| Streaming | The ad-free Lofi Girl stream from step 2 | free |
| Coffee, tea & cookies | FSA-catered: 15 dozen cookies, coffee, tea, and delivery; consider campus or grant funding if available | ≈ $195 |
| Fidget tools (giveaway) | Mostly from the Counseling Center; we bought one bulk pack students can keep | mostly donated |
| Coloring sheets & supplies | Printed sheets, pencils, markers we already had on hand | on hand |
| Puzzles / games | Reused what we already had; reusable year to year | on hand |
| Sensory & craft kits | Playdough, kinetic sand & craft kits (from the Counseling Center) | mostly donated |
| Signage & printing | Flyers, zone signs, and the prompt wall, printed in-house on our own print quota | in-house |
| Reed's example: catering | ≈ $195 | |
What Reed spent: The Faculty Student Association catered refreshments for about $195: 15 dozen Bake Shop cookies ($11/dozen), coffee and tea ($21.25/gallon), and $30 delivery, after our 10% campus discount. It was enough to get us through, with a couple of extra coffees added as the day went. Most fidget tools came from the Counseling Center, which also brought playdough, craft kits, and kinetic sand. Coloring sheets and puzzles were already on hand; snacks and giveaways were donated by the Psychology Club and Spectrum Entertainment Board; and signage was printed in-house, so it cost nothing beyond our print quota. We originally added a month of YouTube Premium ($15.99) on top, but we've since learned the Lofi Girl live stream runs ad-free on its own, so you can skip it. The real cost was the refreshments.
Planning tools
Quick tools to size up your own event. The calculators are editable and pre-filled with Reed's numbers as a starting point.
Budget estimator
Edit the quantities and prices for your campus. The total updates as you type.
| Item | Qty | Unit $ | Line total | |
|---|---|---|---|---|
| Cookies (dozen) | $0 | |||
| Coffee & tea (gallon) | $0 | |||
| Delivery | $0 | |||
| Fidgets / supplies | $0 | |||
| Estimated total | $0 | |||
Catering, roughly
Reed served about 15 dozen cookies and a few gallons each of coffee and tea for a day that peaked at 118 people in the building, and it was enough. Scale to your crowd, and adjust to what they actually drink.
Countdown planner
Pick your event date for a working-backwards timeline you can drop into your planning doc.
- Pick a date above to see your timeline.
Measure your impact
Running your own Lo-Fi Day? Enter your peak headcounts (the most people in at one moment) to compare your busiest day to a typical one. It updates live, so you can screenshot it for a report.
- If you run gate counts, grab your event day and a few comparable days over the same hours.
- If you log counts in Springshare (LibInsight / LibAnalytics), export those same days from there.
- Or take half-hourly headcounts by zone, which is what we do, and they double as your crowd curve.
Crunch your data, no AI needed
Paste your event-day headcounts, one reading per line, and one typical-day number. It works out the totals in your browser, with the same honesty rules we use. A single reading is the people present at that moment, a window total is a sum of readings and not a count of unique people, and the typical day is your baseline. Nothing you type leaves this page.
Messy data, or a custom question? Use an AI prompt
Paste your patron counts into the AI tool of your choice. Both prompts carry the same honesty guardrails we used: a single reading is people present, a window total is a sum (not unique people), and baselines drop the event week.
Analyze the impact
Build interactive charts
Marketing templates
Starter copy you can lift and adapt for your campus, plus a matching social and print kit on the way.
Social & print kit Coming soon
A matching Instagram post, story, 8.5×11 flyer, and brand-kit reference are in the works: fill-in-the-blank, each with an “add your own photo” slot. Check back soon.
Social post
Digital screen / flyer
E-mail / newsletter blurb
Collaborators
Lo-Fi Day works best as a cross-campus collaboration. These are the partners worth reaching out to.
Planning checklist
Tap items to check them off (saved in your browser). Use “Copy” to paste into your own planning doc.
Before the event
- ✓Pick your date (align with finals or a wellness week)
- ✓Reserve the space, plus a separate quiet room
- ✓Line up partners: wellness/counseling, funding, student clubs
- ✓Align a therapy-dog visit with your event date (or set one up with wellness)
- ✓Secure snack and beverage funding from partners
- ✓Bookmark the Lofi Girl live stream (free, no subscription)
- ✓Order fidget tools, coloring supplies, and puzzles
- ✓Make signage and a prompt / reflection wall
- ✓Schedule promo: flyers, screens, social, e-mail
- ✓Plan headcount tracking and photo consent
During the event
- ✓Set up the lo-fi stream on screens and speakers
- ✓Test the audio, set up the two zones, and brief staff
- ✓Keep refreshments and supplies stocked
- ✓Take headcounts at regular intervals
- ✓Snap photos (with consent) and note standout moments
After the event
- ✓Tally your numbers and pull the comparisons
- ✓Collect quotes and feedback from students and staff
- ✓Debrief with your team and partners
- ✓Save the data and photos for next year’s pitch
Additional resources
More to explore, with room to grow.
References & credits
References
- American College Health Association. (2024). American College Health Association–National College Health Assessment III: Undergraduate Student Reference Group Data Report Spring 2024. bit.ly/44gNmDb
- Dsouza, M. P., Shetty, A., Shwetha, T. S., Damodar, P., Pai, A. A., Mathias, R. J., D'Souza, S., & Lewis, N. T. (2024). 'I would want to listen to it as a medicine': Lo-fi music and state anxiety, a mixed-methods pilot study on young adults. International Journal of Adolescence and Youth, 29(1), Article 2388787. doi.org/10.1080/02673843.2024.2388787
- Kirk, U., Ngnoumen, C., Clausel, A., & Purvis, C. K. (2022). Effects of three genres of focus music on heart rate variability and sustained attention. Journal of Cognitive Enhancement, 6(2), 143–158. doi.org/10.1007/s41465-021-00226-3
- Walia, Y., Gupta, R. K., & Tripathi, S. (2026). The impact of depression, anxiety, and stress on cognitive conflict in university students. Conflict Resolution Quarterly, 43(3), 411–417. doi.org/10.1002/crq.70009
- Wilson, G. (2026). "If I'm not stressed, why am I even here?": Exploring narratives of student mental health and belonging on campus. Journal of American College Health, 74(4), 1058–1067. doi.org/10.1080/07448481.2025.2486415
- Zeng, N., & Sobande, F. (2026). Lofi Girl, cultural politics, and dichotomies of digital slowness and productivity. Journal of Gender Studies. Advance online publication. doi.org/10.1080/09589236.2026.2642073
Credits & thanks
- Lofi Girl, whose study streams got me through the pandemic and inspired this event.
- Kerrie Fergen Wilkes, my boss and mentor, who shared an article that sparked this idea, and who supports this program and all the other shenanigans I try out at Fredonia.
- Owen Wagner, who was my intern when I planned the first Lo-Fi Day and has been part of every one since, talking it through with me, bringing a student's perspective, and supporting the logistics. They're now in the University at Buffalo's library science program. Hire them. They're going to do awesome things.
- Icons by Icons8.
- Photos are from Low-Sensory Lo-Fi Day at Daniel A. Reed Library, SUNY Fredonia.
- Page template created with Claude Design and built with Claude Code.